
2021 Dry Bulk Outlook - Supply Growth

Image: Klaveness CLEANBU for illustration purposes, not a standard dry bulk vessel
This is the 7th and final article in a series of articles where Klaveness Research goes through how the fundamentals impacting dry bulk freight rates are shaping up for 2021.
In the first article we started off by having a look at the big picture. In the subsequent five articles we drilled further down into the details of the demand side: iron ore, coal, grains, minor bulks and bauxite. We finish off the series in this article by having a look at the fleet growth.
The link between freight rates and newbuild orders, walking down the memory lane
In the first article in the series we mentioned that dry bulk freight was in a super cycle between 2001 and 2008. The growth in global yard capacity was unable to keep up with the seaborne demand growth triggered by China joining the World Trade Organization in 2001.This led to extensive contracting on existing yards. In addition, we saw many orders at “greenfield” shipyards in China that had to be built before the construction of vessels could even commence. In some cases, contracts were made with a delivery date 5-6 years into the future. This led to unprecedented fleet growth in the 2009 to 2012 period. The peak year in terms of annual percentage fleet growth was in 2010 at 17.1% (see third graph below). While the peak years in terms of deliveries were in 2011 and 2012. Commodity prices, freight rates, asset prices and newbuild contracts collapsed in the months after the financial crisis. However, China soon stepped in and doubled down on their raw material purchases incentivized by the low landed cost of imported commodities. This led to rebounding freight rates and a new wave of newbuild contracting (see left graph below).
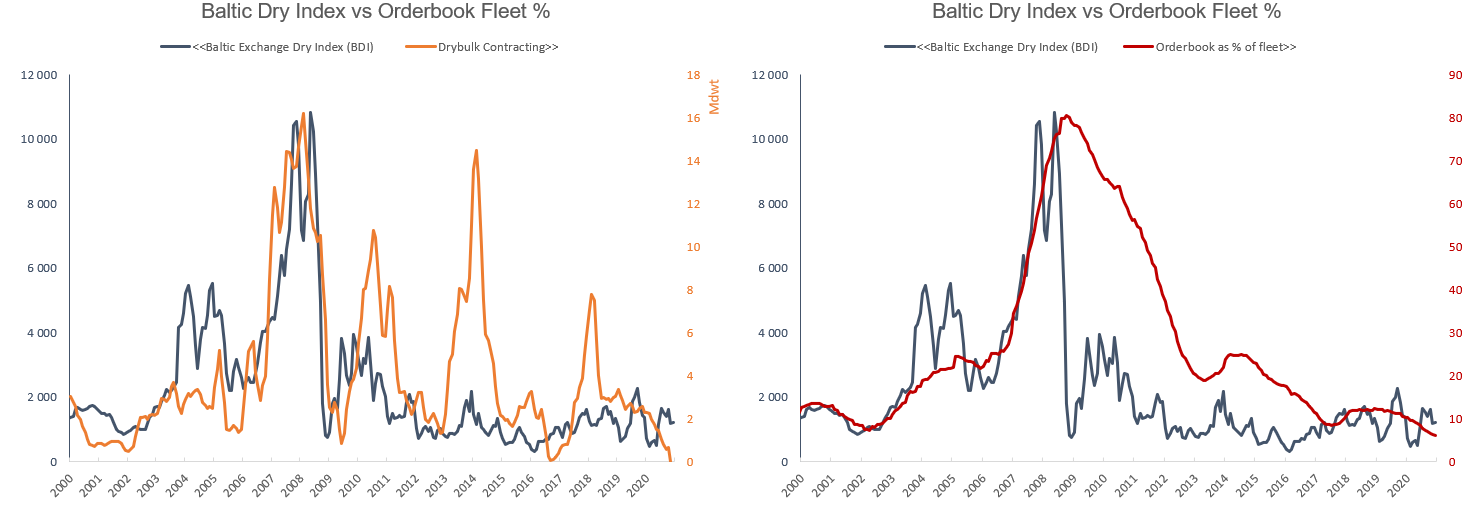
The freight market remained strong through most of 2010 but then started another negative spiral as fleet growth remained elevated and as the Chinese demand growth moderated from the neck breaking pace seen in the period directly after the financial crisis. Deliveries slowed down considerably in 2013(see graph below). As the underlying dry bulk demand was solid, the lower fleet growth was enough to once again pull freight rates higher. At an early stage of the 2013 freight rate recovery it was argued that this time around the higher freight rates would not trigger more orders. The reasoning was that the ship owning companies was strapped for liquidity after buying expensive vessels at the peak of the market. The shipping companies had enough on the plate just servicing their debt obligations, and banks were increasingly restrictive in their lending. Thus, a big wave of ordering was deemed unlikely. However, private equity was drawn to the sector as asset valuations were low and as the freight market was in what appeared to be a cyclical bottom. This unforeseen influx of capital from the outside led to another huge wave of contracting which at its peak almost reached the levels seen in 2008 (see left graph above). This turned out be another false dawn and freight markets trended further down before bottoming out in Q1-2016. Since then the underlying trend in freight rates has been positive. We did see a new wave in contracting in 2017 and 2018, but the amount of orders did not reach the same levels as in the previous waves. It was however enough to increase the year on year fleet growth from a bottom of 2.2% in 2016 to 4.0% in 2019, and about 3.3% in 2020 (see graph below). With limited newbuild orders in the last two years the orderbook as a percentage of the fleet now stands at 6.3% (see right graph above), the lowest level in Clarksons timeseries dating back to 1996.

Fleet growth in 2021/2022
Based on the current level of the orderbook we can with a high level of certainty predict that fleet growth will be at historical low levels in 2021 and 2022. We expect demolition in 2021 and 2022 to be on more or less on par with this year as the effects from higher freight and fairly low bunker prices limits the incentives for scrapping older inefficient tonnage. We expect total fleet growth in 2021 to end at 1.6%, which will be the lowest fleet growth recorded since 1999. For 2022 we expect fleet growth to increase slightly to 1.9%. This includes a guesstimate of another 6.2Mdwt of contracts will be added to orderbook with delivery in 2022. The average lead time between orders and delivery in recent years has been more than 24 months so time is running out for orders with delivery in 2022. However, there will also be contracts that has already been signed which as of today is not included in the orderbook.
We expect the fleet growth in 2021 to be lower than in 2020 for all segments. The fleet growth in the Capesize and Handysize segment is expected to be very low at 0.9 and 0.5% respectively. Fleet growth in the Panamax and Supramax segments are expected to come in at 2.7% and 2.3% respectively. Going into 2022 we expect the fleet growth to be 1.6% in Capesize segment, 2.4% in the Panamax and Supramax segment and 1.3% in the Handysize segment.

We are confident that the dry bulk fleet growth will be at historical lows in 2021 and 2022. What happens in 2023 and beyond is more open for debate. As we walked down the memory lane earlier in the article, we saw that any uptick in freight rates in the past 20 years has triggered big waves of newbuild orders. We believe it is very likely that freight rates will increase in 2021 and 2022 as low fleet growth combines with a seaborne dry bulk trade that recovers from the black swan events of Brumadinho and covid-19. Is there any reason not to expect a big wave of newbuilding orders this time around if the freight market improves? We certainly believe that higher freight markets will trigger more newbuild orders in the coming years. However, we also believe that fleet growth in the next 5 years is likely to be at low levels due to uncertainties around the choice of fuel and propulsion systems. Klaveness will monitor the decarbonization of shipping closely going forward and have established a team named ZeroLab by Klaveness. In the following paragraphs, Head of ZeroLab Martin Prokosch provides a brief introduction to this large topic.
The initial IMO Greenhouse Gas (GHG) Strategy, adopted in 2018, sets ambitious targets to reduce carbon intensity of international shipping by 40% in 2030 compared to 2008 and reduce the absolute GHG emissions from ships with 50% by 2050, compared to 2008. These targets are illustrated in the figure below, showing both the development in seaborne trade and GHG emissions from shipping, both indexed to 100 in 2008 (Source: IMO: Fourth GHG Study, 2020). In the years after 2008, the emissions were decoupled from further growth in seaborne trade. This was largely due to slow steaming of vessels and partly due to increased energy efficiency in new vessels (ECO-ships). In the recent years the absolute emissions have again been on the rise. To reach the 40% intensity reduction target in 2030, the absolute emissions will need to stay constant while seaborne trade recovers from COVID-19 and again continues to increase as expected.

While the 2030 targets are achievable with current technologies and available alternative fuel types (e.g., LNG), the 2050 targets are much harder to reach. To achieve a reduction of 50% in absolute emissions, the average vessel needs to emit 70-80% less in 2050 vs. 2008 to compensate for the expected growth in seaborne trade. Further, for the shipping sector to be fully aligned with the +1.5-degree target in the Paris agreement, the absolute emissions from this sector will need to reach net zero by 2050.
The usual tools will not bring us there; in order to reach the 2050 emissions targets (either IMO or full alignment with the Paris agreement), new energy sources and fuels need to be introduced for shipping. Slow-steaming and energy efficiency measures reduced the typical emissions of a Dry Bulk Panamax vessel by ~30% from 2008 to 2020 (equivalent to a reduction of ~10 tCO2e per year), but there is limited remaining potential in these measures. To bring the emissions from such a vessel down to 0-30% of the 2008 baseline, the GHG emissions related to the energy sources and fuel(s) need to be close to zero.

Conclusion
We are confident that the supply growth in 2021 and 2022 will be at historical low levels. In the absence of new black swan events of a similar magnitude as the Brumadinho disaster and the covid19 epidemic we firmly believe that 2021 and 2022 will deliver demand growth that exceeds the fleet growth. This will increase freight rates. While we do believe that higher freight will trigger more newbuild orders we expect supply growth to trail demand growth in the coming 5 years due to the uncertainty around the choice of fuel and propulsion systems.
So, there you have it. This concludes our 2021 dry bulk outlook series. Hopefully, it has given you as a reader some food for thought.
*Historical fleet growth and orderbook is based on raw data from Clarksons
** We use the following segmentation rules: Capesize (100kdwt+), Panamax (70-100kdwt), Supramax (40-70kdwt), Handysize (10-40kdwt), Other (<10kdwt)